
PWC: The World in 2050
PWC came out with its projections for major countries in 2050 below. These studies are innocuous but their scientific value suspect. Nothing to quibble about China and Canada’s positions (fairly conventional) but PWC is too optimistic about India. Especially the average growth rate of around 5.6% over 40 years which sounds unsustainably high. (PWC projects China’s to average around 4.2% over that period which sounds about right or could be a little higher.) A few years ago, India bulls were saying India would surpass China’s growth rate within a few years but look at where India’s growth is now. Numerous factors go into economic growth so these multi-decade studies are educated guesses at best. But fun though.
——————–
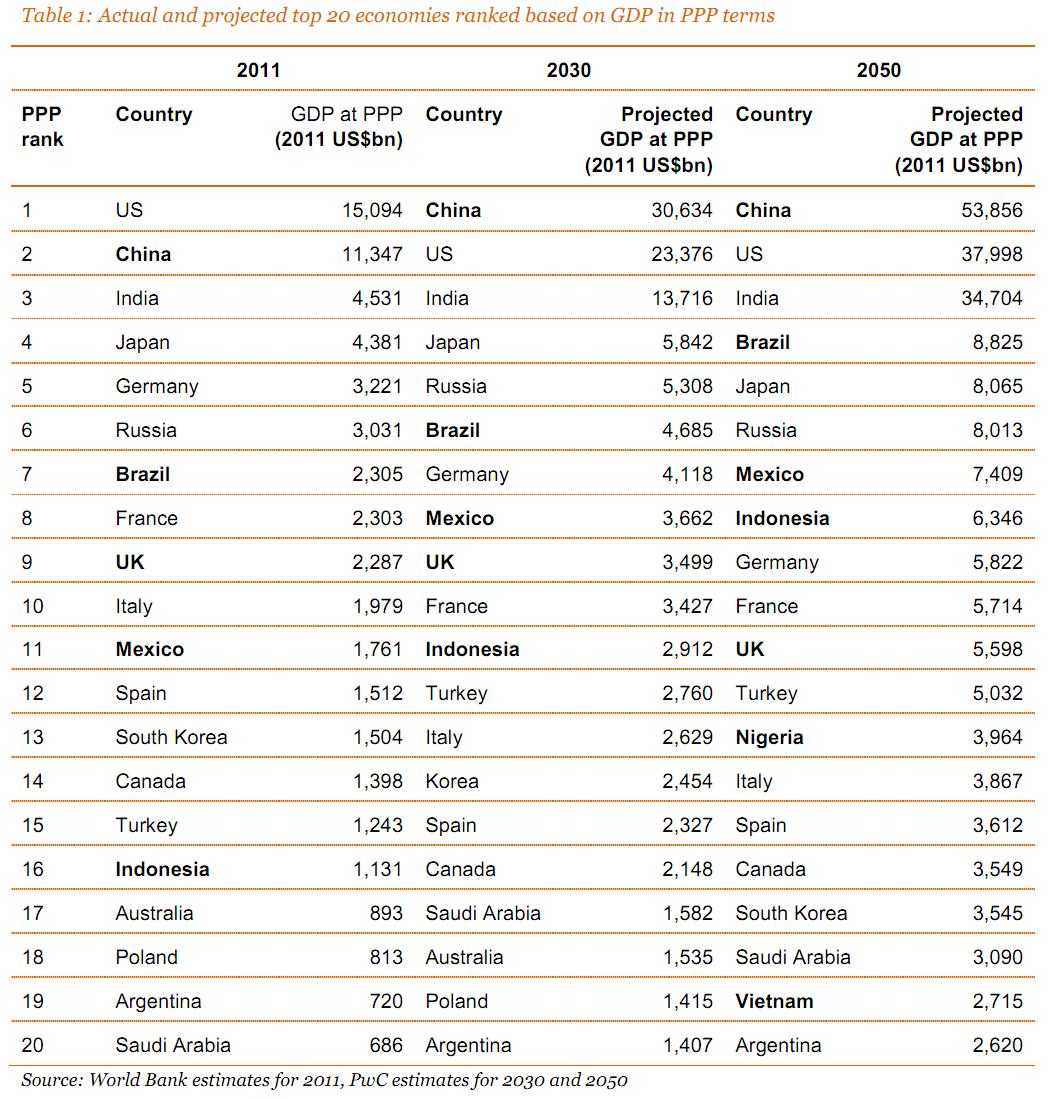
The original PwC ‘World in 2050’ study in 2006 covered the 17 largest economies: the G7 (France, Germany, Italy, Japan, the UK, the US and Canada) plus Spain, Australia and South Korea; and the E7 (Brazil, Russia, India, China, Indonesia, Mexico and Turkey).
The extended 2013 study – titled World in 2050 The BRICs and Beyond: Prospects, challenges and opportunities – also includes Vietnam, Nigeria, South Africa, Malaysia, Poland, Saudi Arabia and Argentina.
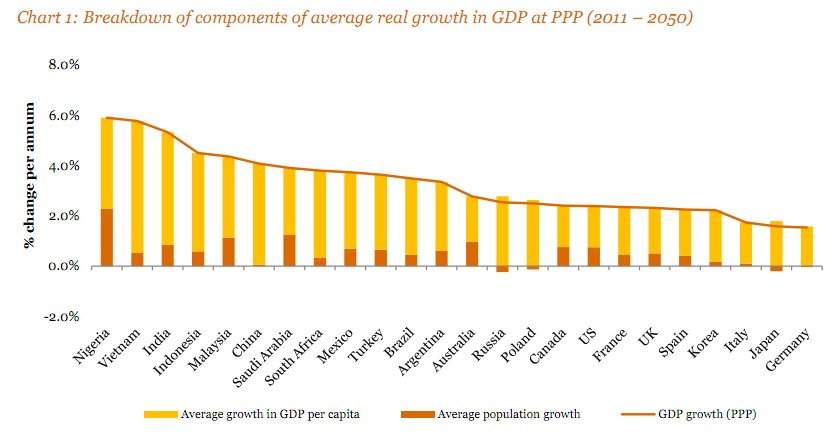
The report concludes that the emerging economies are set to grow much faster than the G7 over the next four decades. Figures for average growth in GDP in purchasing power parity (PPP) terms (which adjusts for price level differences across countries) show Nigeria leading the way over the period from 2012 to 2050, followed by Vietnam, India, Indonesia, Malaysia, China, Saudi Arabia and South Africa.
This means that, in PPP terms:
- The E7 could overtake the G7 before 2020
- By 2050 China, the US and India could be by far the largest economies – with a big gap to Brazil in fourth place, ahead of Japan
- And by the same time, Russia, Mexico and Indonesia could be bigger than Germany or the UK; Turkey could overtake Italy; and Nigeria could rise up the league table, as could Vietnam and South Africa in the longer term.
Here are a couple charts comparing China and India’s growth from the late 1990s to 2011/2012
|
Country |
1999 |
2000 |
2002 |
2003 |
2004 |
2005 |
2006 |
2007 |
2008 |
2009 |
2010 |
2011 |
|
India |
5.5 |
6 |
4.3 |
8.3 |
6.2 |
8.4 |
9.2 |
9 |
7.4 |
7.4 |
10.4 |
7.2 |
12 year average= 7.44% (missing 2001)

From 1979 until 2010, China’s average annual was 9.91%, reaching an historical high of 15.2% in 1984 and a record low of 3.8% in 1990. Based on the current price, the country’s average annual GDP growth in these 32 years was 15.8%, reaching an historical high of 36.41% in 1994 and a record low of 6.25% in 1999.